5. Results
5.1. Comparison of diagnostic methods for detecting lactose maldigesters
The final number of participants in Studies I-IV was 72. Overall, there were 89, but some of the subjects volunteered for more than one study and 10 withdrew or were excluded for various reasons.
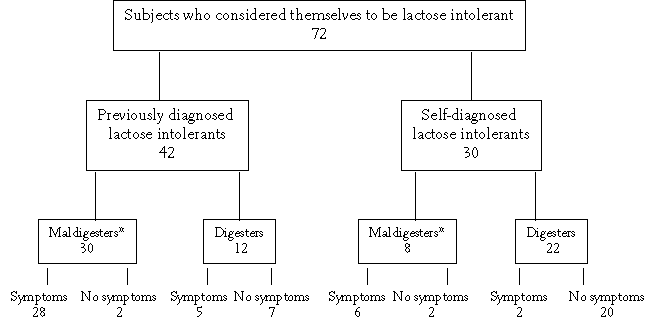
Of the 72 participants 42 had previously been diagnosed as being lactose intolerant. These diagnoses were made by official health professionals, or else the subjects were diagnosed in earlier lactose intolerance studies by our group (Vesa et al 1996, Teuri et al 1999). Thirty were self-diagnosed lactose intolerants. A third of the previously diagnosed and two thirds of the self-diagnosed subjects proved to be lactose digesters according to the Golden Standard diagnosis (see Chapter 4) (Figure 5.1). About one tenth (4/38) of the maldigesters were asymptomatic and about 20% (7/34) of the digesters were symptomatic according to the oral lactose tolerance test (Figure 5.1).
In Study I, in order to test the usefulness of the portable breath hydrogen analyser Micro H2, altered breath hydrogen concentration was measured with the two analysers, the Micro H2 and the Quintron MicroLyzer. Even though the highest increase in the exhaled breath hydrogen over the baseline varied greatly (44-366 ppm for Micro H2 and 27-187 ppm for Quintron MicroLyzer), the diagnoses were 100% identical. Since the Micro H2 proved to be reliable for detecting lactose malabsorption, all the data of breath hydrogen concentrations presented here is measurements taken with the Micro H2.
In addition to proving the usefulness of the Micro H2 breath hydrogen analyser, the data of Study I made it possible to compare the three diagnostic variables (breath hydrogen, blood glucose and urine galactose) for detecting lactose maldigesters. In order to increase the number of subjects the comparison of the test variables was re-made with subjects participating in Studies I-III. Each subject is considered once only, even if she participated in more than one study. If this was the case, the first study in which she participated was chosen for this comparison. In the end the final number of subjects in Studies I-III was 70, of whom 35 proved to be lactose maldigesters according to the Golden Standard.
When these three variables for diagnosing hypolactasia were compared, none of them alone recognised all the maldigesters or all the digesters (Table 5.1). The number of misdiagnosed maldigesters was most obvious if the blood glucose test was used on its own (3/35), and the largest number of lactose digesters (5/35) was misdiagnosed by the urine galactose test (Table 5.1). The sensitivity (the ability of the test to recognise lactose maldigesters) of the breath hydrogen test was 94% (33/35), of the blood glucose test, 91%, (32/35), and the urine galactose test, 97% (34/35) (Table 5.2). The specificity of the tests (the ability to recognise lactose digesters), was 94%, 91%, and 86% respectively (Table 5.2).
Table 5.1. Studies I-III. Combination of results of breath hydrogen, blood glucose, and urine galactose for detecting lactose maldigesters (LM according to the Golden Standard).
| Breath hydrogen |
|
fB-glucose |
Urine galactose |
|
|
|
|
|
Positive*** |
Negative |
Total |
| Positive if * ≥ 20 ppm | ** increase ≤ 1.1 mmol/l | *** ≤ 20 mg/3-4 h |
| Positive* |
|
Positive** |
29LM |
1LM |
30 |
|
|
Negative |
3LM |
2 |
5 |
|
|
Total |
32 |
3 |
35 |
|
|
|
|
|
|
|
|
fB-glucose |
|
|
|
| Negative |
|
Positive |
2LM |
3 |
5 |
|
|
Negative |
5 |
25 |
30 |
|
|
Total |
7 |
28 |
35 |
Table 5.2. Studies I-III. Diagnostic characteristics of breath hydrogen, blood glucose, urine galactose tests, and symptoms (symptom score ≥ 12 / 4 h) compared with the Golden Standard. n=70.
|
Breath hydrogen |
fB-glucose |
Urinary galactose |
Symptoms |
| Sensitivity (%) =[true positives /(true positives + false positives)×100 |
| Specificity (%) = [true negatives/(true negatives + false negatives)]×100 |
| Positive predictive value (%) = [true positives/(true positives + false positives)×(100 |
| Negative predictive value (%) = [true negatives/(true negatives + false negatives)]×100 |
|
Estimate |
95% CI |
Estimate |
95% CI |
Estimate |
95% CI |
Estimate |
95% CI |
| Sensitivity |
94 |
88-100 |
91 |
84-100 |
97 |
93-100 |
89 |
82-98 |
| Specificity |
94 |
88-100 |
91 |
84-100 |
86 |
78-96 |
77 |
67-89 |
| Positive predictive value |
94 |
88-100 |
91 |
84-100 |
87 |
79-97 |
79 |
69-91 |
| Negative predictive value |
94 |
88-100 |
91 |
84-100 |
97 |
93-100 |
87 |
79-97 |
The percentages of agreement and Cohen's kappa for the combination of breath hydrogen, blood glucose and urine galactose tests and gastrointestinal symptoms can be seen in Table 5.3. Differences between the test pairs were small and no statistical significances were found. Thus, none of the combinations is superior for detecting lactose maldigestion.
Table 5.3. Studies I-III. Percentages of agreement and Cohen's kappa for the pairwise comparisons of breath hydrogen (H2), blood glucose (fB-gluc) and urine galactose (U-gal) and gastrointestinal symptoms (symptom score ≥ 12 / 4 h). n=70.
|
|
|
Percentage of agreement |
|
Cohen's kappa |
|
|
|
|
% |
95% CI |
κ |
95% CI |
|
| H2 |
vs |
fB-gluc |
86 |
78-96 |
0.71 |
0.55-0.88 |
|
|
U-gal |
86 |
78-96 |
0.71 |
0.55-0.88 |
|
|
Symptoms |
83 |
74-94 |
0.66 |
0.48-0.83 |
| fB-gluc |
vs |
U-gal |
83 |
74-94 |
0.66 |
0.48-0.835 |
|
|
Symptoms |
77 |
67-89 |
0.54 |
0.35-0.74 |
| U-gal |
vs |
Symptoms |
77 |
67-89 |
0.54 |
0.34-0.74 |
The diagnostic limit for a clinically significant symptom score was ≥ 12. The sensitivity, specificity, positive predictive value, and negative predictive value of the symptom questionnaire in Studies I-III can be seen in Table 5.2. The best percentage of agreement with Cohen's kappa for gastrointestinal symptoms and a positive test variable was with the breath hydrogen test (Table 5.3). Of the maldigesters, 83% (31/35) with a positive breath hydrogen test had an increased symptom score. On the other hand, about 20% of the lactose digesters with negative breath hydrogen had significantly increased symptoms. The percentage of agreement of the symptoms and both the blood glucose and the urine galactose tests was 77% (95% CI 67 to 89) and Cohen's kappa for both these was 0.54 (Table 5.3).
In Studies II and IV there was a health questionnaire in which the subjects answered questions about gastrointestinal symptoms and their correlation to milk and dairy products (unpublished data). These questions were answered before the test and the diagnosis of lactose intolerance. Both the lactose maldigesters and the digesters experienced flatulence as the most uncomfortable gastrointestinal symptom (Table 5.4). In the oral lactose tolerance test after 50 g lactose, 1/27 of these maldigesters was asymptomatic whereas 4/7 of the lactose digesters were symptomatic with at least a 12-point symptom score.
Table 5.4. Studies II and IV. Gastrointestinal symptoms that were reported as the most uncomfortable, i.e. number of subjects reporting the order of discomfort, by lactose maldigesters (n=28) and digesters (n=7).
|
Great discomfort |
Some or slight discomfort |
No discomfort |
|
| Maldigesters |
|
|
|
|---|
| Flatulence |
18 |
10 |
0 |
| Abdominal bloating |
10 |
16 |
1 |
| Abdominal pain |
17 |
7 |
3 |
| Diarrhoea |
8 |
10 |
9 |
| Constipation |
3 |
11 |
7 |
|
|
|
|
| Digesters |
|
|
|
|---|
| Flatulence |
4 |
2 |
1 |
| Abdominal bloating |
3 |
2 |
2 |
| Abdominal pain |
1 |
4 |
1 |
| Diarrhoea |
1 |
4 |
2 |
| Constipation |
2 |
4 |
2 |
5.2. Modification of gastric emptying and the temperature of the test solution
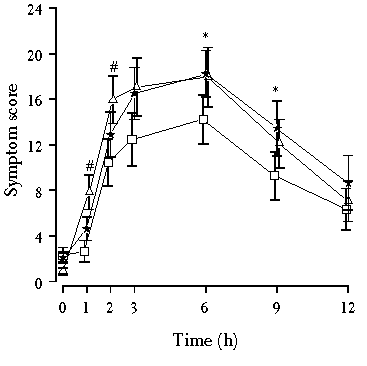
In Study II gastric emptying was retarded with a single oral dose of propantheline (as bromide, 15 mg) and speeded up with metoclopramide (as hydrochloride, 10 mg). The most obvious result of modified gastric emptying was the diminishing of gastrointestinal symptoms after the ingestion of propantheline (Figure 5.2). The symptom score (flatulence + borborygmi + abdominal bloating + abdominal pain) was significantly reduced by propantheline compared to the metoclopramide, after 1 h and 2 h, or compared to the placebo after 6 h and 9 h (Figure 5.2). The acceleration of gastric emptying by metoclopramide did not affect the symptom score (Figure 5.2) or any single symptom (Table 5.5) compared with the placebo.
The nature of lactose-induced gastrointestinal symptoms can be clearly seen in Figure 5.2. During an oral lactose tolerance test it takes a few hours for clinically significant symptoms to develop. Symptoms last several hours and their severity diminishes more slowly than it takes to develop, making the symptom curve skew to the right. Except in the case of abdominal bloating, the same shape as the overall symptoms curve can be seen in each individual symptom. With abdominal bloating, regardless of the intervention, reduction in the severity of the bloating was much slower than in any other symptom.
The 12-h sum of symptom scores for flatulence, borborygmi, abdominal bloating and pain can be seen in Table 5.5. Propantheline reduced abdominal bloating compared to the placebo. Compared to metoclopramide, propantheline reduced both abdominal bloating and abdominal pain.
Table 5.5. Study II. The 12-h sum of symptom scores of flatulence, borborygmi, abdominal bloating and abdominal pain, during the 12 h follow-up in lactose maldigesters after oral ingestion of 50 g lactose with either propantheline (as bromide, 15 mg), metoclopramide (as hydrochloride, 10 mg) or a placebo. Mean (min to max), n=18.
| 12-h Symptom scores |
Placebo |
Propantheline |
Metoclopramide |
Friedman p-value1 |
| 1 Significance of treatment effect in a non-parametric Friedman analysis |
| M p<0.05 compared to metoclopramide |
| P p<0.05 compared to the placebo |
| Flatulence |
29 (6 to 51) |
25 (6 to 52) |
29 (10 to 55) |
0.09 |
| Borborygmi |
21 (0 to 51) |
17 (4 to 45) |
20 (0 to 51) |
0.16 |
| Abdominal bloating |
22 (0 to 53) |
16 (0 to 51) P, M |
21 (0 to 44) |
0.02 |
| Abdominal pain |
14 (0 to 37) |
11 (0 to 44) M |
14 (0 to 40) |
0.19 |
The retarding of gastric emptying did not modify the total gastrointestinal transit time as measured with carmine dye. Transit time varied greatly (1.5 h - 72 h) independent of the treatment, because of large interindividual variations. There was no correlation between transit time and the development of gastrointestinal symptoms following the ingestion of lactose. Spearman's rho correlation values were very near zero, varying between -0.11 and 0.22.
In Study III the temperature of the lactose solution affected each of the symptoms differently. Due to these fluctuations, the symptom score of flatulence + borborygmi + abdominal bloating + abdominal pain was of little use in estimating the effect of the test solutions. The effects of a cold test solution were more intense than the effects of a hot solution, compared with the room temperature solution. The cold test solution tended to increase abdominal pain (p=0.09) and reduced flatulence and bloating compared with the room temperature solution, expressed as the 12-hour symptom scores (Table 5.6).
Table 5.6. Study III. The sum of symptom scores of flatulence, borborygmi, abdominal bloating and pain during the 12-h follow-up in lactose maldigesters after a room temperature, a cold and a hot solution of 50 g lactose. Mean (min to max), n=10.
| 12 -h Symptom scores |
Room temperature
21-22° C |
Cold
2-3° C |
Hot
55-58° C |
Friedman
p-value1 |
| 1 Significance of treatment effect in a non-parametric Friedman analysis |
| R p<0.05 compared to the room temperature test solution |
| Flatulence |
31 (20 to 44) |
24 (7 to 38) R |
31 (10 to 52) |
0.01 |
| Borborygmi |
19 (1 to 35) |
19 (0 to 32) |
20 (3 to 38) |
0.25 |
| Abdominal bloating |
27 (17 to 34) |
23 (8 to 32) R |
30 (11 to 42) |
0.02 |
| Abdominal pain |
12 (0 to 30) |
18 (0 to 33) |
17 (5 to 39) |
0.08 |
5.3. Measurement of inflammatory markers following the ingestion of lactose
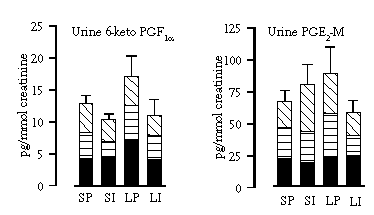
The purpose of Study IV was to investigate the possible role of inflammation in provoking gastrointestinal symptoms following the ingestion of lactose. The enhanced or reduced production of prostaglandins as a signal for possible inflammation were measured as urine and plasma PGE2-M excretions. The synthesis of prostaglandins via inducible COX-2 increases with inflammation. In the urinary excretion of PGE2-M an increase of about 30% in the excretion was noticed after the lactose intake compared with the sucrose intake (Figure 5.3). Ibubrofen tended to inhibit this increase. The same increase and its inhibition by ibuprofen was also seen with the urinary excretion of another metabolite of prostaglandins, 6-keto-prostaglandin F1α, but with both these variables, PGE2-M and 6-keto PGF1α, interindividual variation was considerable and no statistically significant differences in the inhibition by ibuprofen were remarked (Figure 5.3). In the plasma PGE2-M excretion there were no differences between the lactose and the sucrose intakes, with or without ibuprofen.
In no other indicators of inflammation that were used - e.g. nitric oxide production measured as the urinary excretion of cyclic GMP and NOx , and blood leukocyte count (unpublished data, Table 5.7) - were any differences seen between the lactose and the sucrose intake, with or without ibuprofen.
Table 5.7. Study IV. Blood leukocyte counts (× 109 / l) in four lactose maldigesters before and after a lactose tolerance test, with and without a single oral dose of ibuprofen.
| Subject n:o |
|
Lactose + Placebo |
Lactose + Ibuprofen |
|
|
Baseline |
3 h |
8 h |
Baseline |
3 h |
8 h |
|
| 4 |
|
3.2 |
4.5 |
3.8 |
3.0 |
3.6 |
4.9 |
| 5 |
|
5.1 |
4.5 |
5.2 |
5.9 |
5.6 |
7.7 |
| 7 |
|
6.0 |
5.8 |
6.1 |
6.4 |
6.2 |
7.1 |
| 10 |
|
9.4 |
8.2 |
9.7 |
10.7 |
10.1 |
10.9 |
5.4. Induction of lactase with lactose
In Study V the dietary modification of lactase enzyme activity was investigated in the rat intestine. Lactase activity was found only in the small intestine, with the exception of those rats that received the largest doses of lactose. In these, it also appeared in the colon. There was no activity present, measured spectrophotometrically, in the oesophagus, the stomach or in the colon of the control animals or those who received the smallest doses of lactose. Water intake and weight gain during the study period can be seen in Table 5.8.
Table 5.8. Study V. The effect of a seven-day supplementation of lactose on weight gain and daily water intake. Mean ± SEM, n=5-6.
|
Lactose g/day |
|
0 |
0.7 |
2.1 |
2.6 |
| *p<0.05, **p<0.001 ANOVA with Dunnett's multiple comparison test (control vs test group) |
| Weight gain (g/week) |
44.3 ± 5.4 |
20.2 ± 5.4* |
18.2 ± 7.3* |
23.8 ± 7.9* |
| Water intake (ml/rat/day) |
32.4 ± 0.7 |
23.3 ± 2.1 |
20.6 ± 2.6* |
12.7 ± 1.5** |
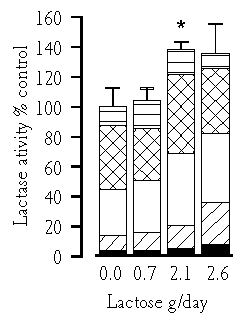
The optical density of lactase immunoreactivity was measured from the proximal part of the jejunum. In the control animals this was 0.19 ± 0.01 arbitrary units. It increased 25-40% in the lactose supplemented groups. Dietary lactose increased the activity of lactase, especially in the proximal (p=0.01) and middle parts of the jejunum (p=0.02). If the total lactase activity of the control group, measured by combining the activities of five small intestinal biopsies, is 100%, a lactose supplementation of 10-12 g/kg body weight/day increased this activity by about 40% (Figure 5.4).


